Alexandrina Council releases greenhouse gasses (or GHG for short) as a part of day to day operations, servicing the residents and communities of the region. From the electricity used to light our roads, buildings and community centres, to the petrol burnt by trucks transporting waste to depots, Alexandrina Council is responsible for producing GHG emissions.
Carbon emissions (CO2) are part of GHG, together with methane (CH4), nitrous oxide (N2O) and ozone (O3). GHG gases in the atmosphere absorb and re-emit heat, thereby keeping the planet's atmosphere warmer than it otherwise would be.
To successfully reduce Council’s corporate emissions, emissions must be able accurately monitored. Alexandrina Council has been monitoring its emissions since 2015.
Council’s largest electricity users are the Fleurieu Regional Aquatic Centre, wastewater treatment and pumping stations, and Council’s Administration and Library buildings. As can be seen in Figure 1 and Figure 2, a significant portion of Council’s emissions is attributed to electricity usage, followed closely by transportation (transport fuel).
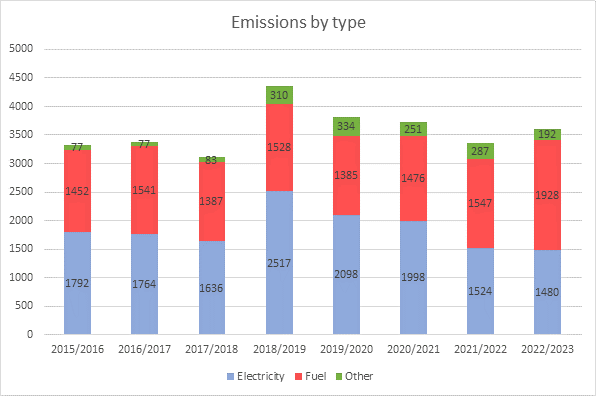 Figure 1: Council’s emissions since 2015: Electricity, fuel and other (e.g. waste disposal, paper and water use)
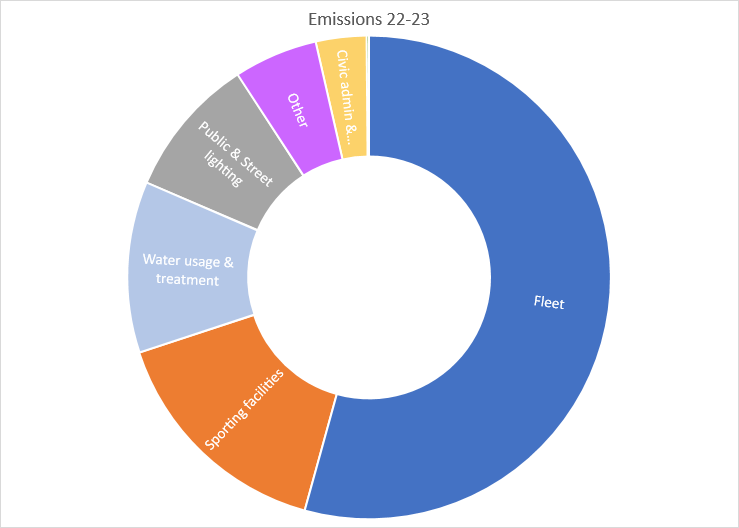 Figure 2: 2022/23 Council’s emissions by category (Other = depots, community centres, parks, campgrounds, public facilities)
GHG emissions are measured as tonnes of carbon dioxide equivalence (tCO2-e). The ‘GHG Corporate Standard’ classifies a company's GHG emissions into three 'scopes'. For our corporate emissions this means:
- Scope 1 = Direct emissions from Council (i.e. transport fuels);
- Scope 2 = Indirect emissions generated by electricity consumed by Council (i.e. street lights, council buildings); and
- Scope 3 = Indirect emissions as a result of Council’s activities, but not from sources owned or controlled by council (i.e. waste disposal, paper and water use).
Alexandrina’s scope emissions are illustrated in Figure 3.
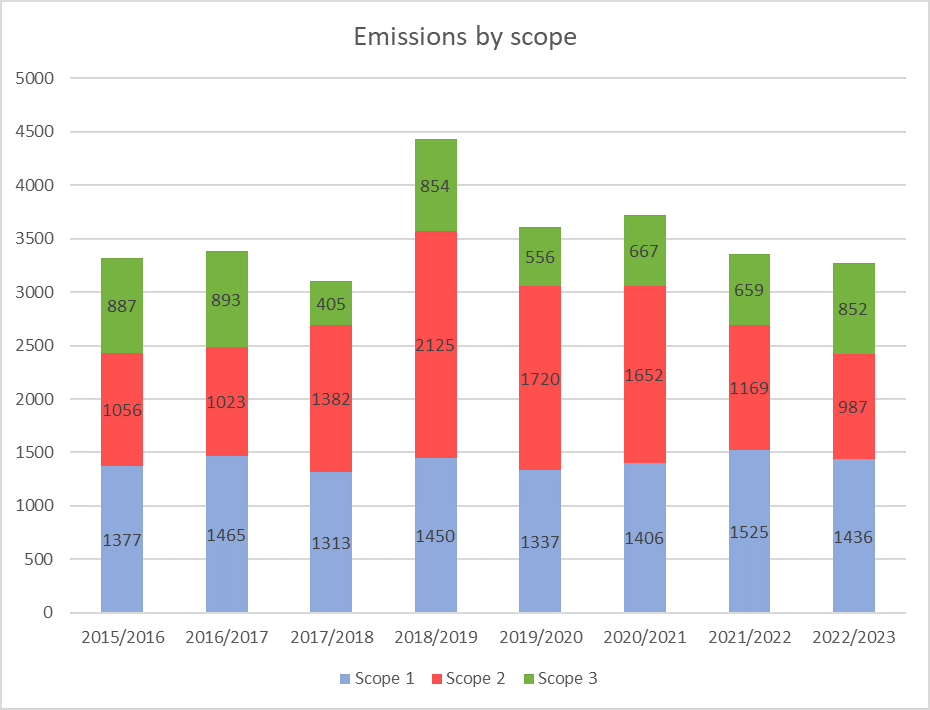 Figure 3: Council emissions by scope since 2015
As can be seen in Figures 1 and 3, Council’s emissions have risen from 2015 to 2019. This is due to several reasons such as: ongoing population increase of over 5% since 2014 resulting in an expansion of services; the addition of the Fleurieu Regional Aquatic Centre; and a change in how emissions are calculated.
The good news is that because Council is actively reducing its corporate emissions, the overall emissions are falling again since its peak in 2018/2019.
Learn more about on how Council is reducing Council’s GHG emissions here.