Tree canopy coverage and heat maps – Mount Compass
The canopy cover and radiant temperature visualisation maps for Mount Compass are shown below:
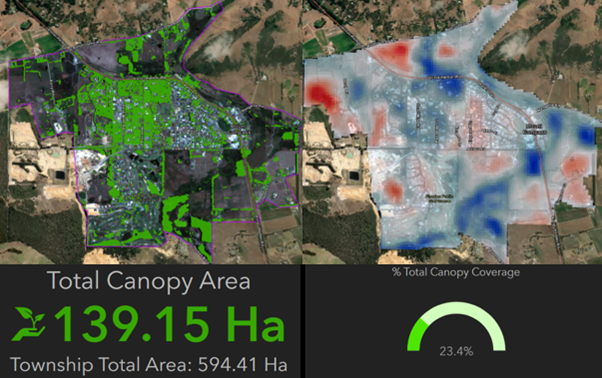 Aerial imagery showing Mount Compass’s canopy coverage on the left, and the heat map of the township (radiant temperature visualisation) on the right. Data was captured on 26 January 2022. © Active Green Services
In 2022, Council commissioned a study to establish a benchmark of tree canopy cover and radiant temperature visualisation (‘heat maps’) across 11 townships in Alexandrina. The study assessed high-resolution satellite imagery using artificial intelligence. Thermal imaging (infrared) was also acquired and correlated to the canopy layer by linking the data geospatially via an ESRI© application.
The overall canopy cover averaged 17.6% across Alexandrina’s 11 townships; ranging from 11.7% to 49.3%.
The study showed that in January 2022, Mount Compass had a tree canopy cover of 23.4%.
The results for Mount Compass are as follows:
Tree canopy cover across Mount Compass
The township total area of Mount Compass is 594.41 hectares (ha), with 139.15ha identified as the total canopy area. This equates to 23.4% total canopy coverage in Mount Compass.
Tree canopy cover on private land
Most of the land in Mount Compass is privately owned: 532.65ha of the township total area is private land, with 123ha of this contributing to the total canopy area. This means that 88.39% of the total canopy cover is found on private land.
Tree canopy cover on Council land
11.43% of the total canopy cover is on Council land: 61.40ha of the township total area is under Council’s care and control, with 15.89ha contributing to the total canopy area.
Tree canopy cover on Crown land
A very small percentage of land is Crown land: 0.36ha of the township total area is on Crown land, with 0.26ha of this contributing to the total canopy area. This equates to 0.18% total canopy coverage in Mount Compass.
Radiant temperature of Mount Compass
The radiant temperature visualisation (‘heat map’) undertaken for Mount Compass (see above) clearly shows the cooling effect that tree canopies provide.
The hottest areas are found in paddocks as relative radiant temperature of open parks and fields can be high compared to treed areas.
It is important to note is that radiant temperatures are not air temperatures. Satellite sensing is typically done at night. Radiant heat is measured as infrared spectral intensity and expressed as temperature mathematically, through prior research using controlled experiments correlating the influence of surface temperatures on perception of heat by a collective of people.
To go back to the main page of the Tree Canopy Report and links to other townships, click here.